I am pretty sure many of you using MS Project 2013 already know this one, but I just woke up to it, and documenting it for the rest of the population.
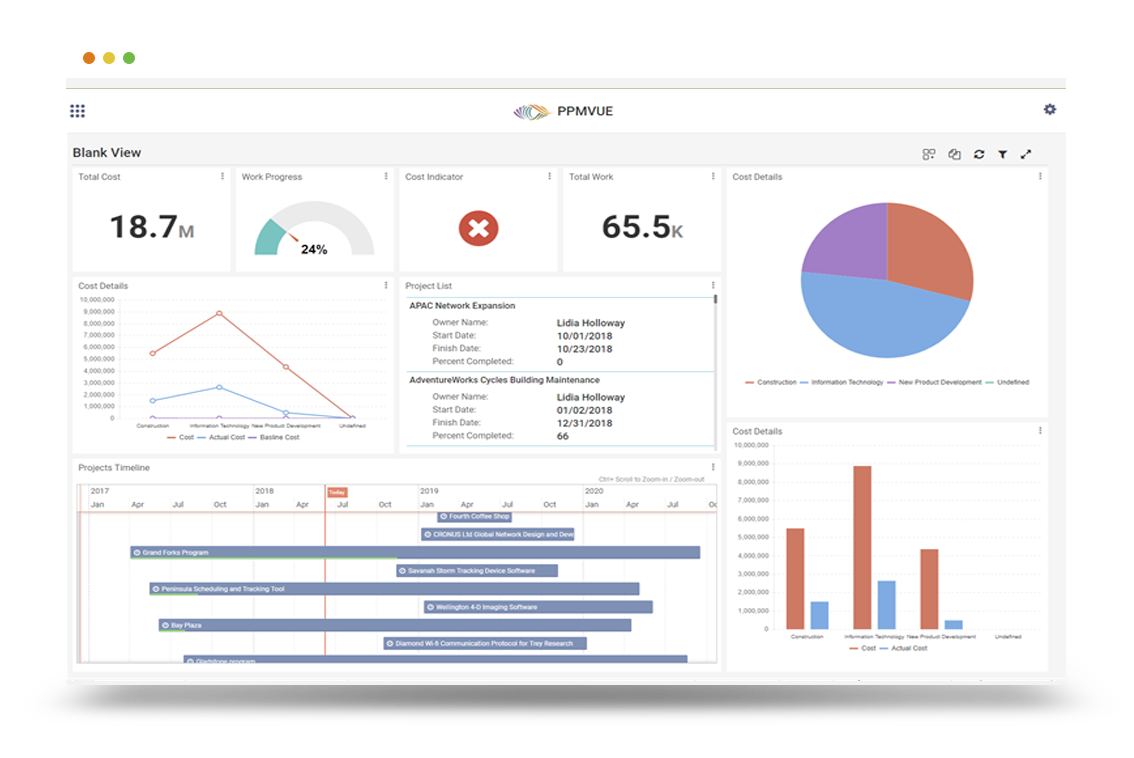
One cool thing about Reports in Project 2013 is that they can be used in a Split View, like the timeline. For example, you could have a cool dashboard showing up along with the Gantt Chart as shown below:
And it is so easy to do. Here are the steps:
- Open Project 2013, and Click on Reports Tab
- Select the Report of your choice.
- Now Navigate to the View Tab, and select Details >> Gantt Chart
That’s it. The view will display as shown in the first screenshot above. And if you save with that same display, next time when you open it will come back up. Of course, you can mix and match what you want to display in each of the split areas.
Unfortunately, there does not seem to be a way of saving the view and making it part of Enterprise Global.
Hope it helps somebody.


