MS Project Timelines are a great way to display the project schedule at a milestone level. Timelines are often used in project status reports and meetings. What timelines lack are historical information about the milestones. How do the current milestones compare to the baseline milestones? How much did the milestone shift from the last time we reported status?
These questions are asked by management on a regular basis, so they can determine if the milestone shifted and if there are any trends in their movement.
To easily provide this information, a Milestone Table is just what you need!
Why use Timelines?
A typical Microsoft Project timeline looks like this:
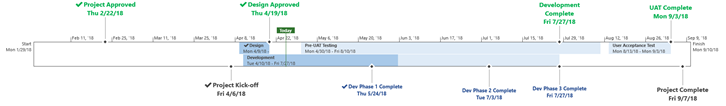
The summary tasks are in the center and the milestones hang off the perimeter of the project Timeline. You can display task status which will check completed milestones and highlight the summary work completed with a darker shade. The milestone and summary task dates can be displayed dates and you can change the font size & color.
Since the Timeline view is based on current schedule information, the Timeline milestone dates are always current. You cannot display milestone baseline information unless you manually enter those as separate tasks in your project schedule. Another way to display historical information is to create a Milestone Table.
The benefits of a project Timeline are:
- Provides a snapshot of the project
- Shows interdependencies
- Highlights Major Milestones
- Focuses on a specific period
- Supports status reporting
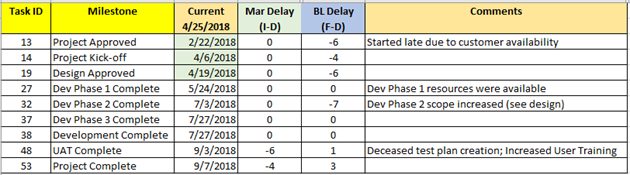
Milestone Table Creation
The milestone table is made up of the following columns:
- Team / category – for grouping the milestones (optional)
- Task ID – from the project schedule; used for updating the milestone information
- Milestone – from the project schedule; used for reporting
- Current (date) – current finish milestone date
- (Previous Month) Var – calculated variance (baseline finish date – current finish date)
- Baseline (date) – baseline finish milestone date
- Baseline Var – calculated variance (previous month finish date – current finish date)
- Comments – explain why the variance
- Previous Project Schedules – previous milestone finish dates
Here is an example of a Milestone Table:
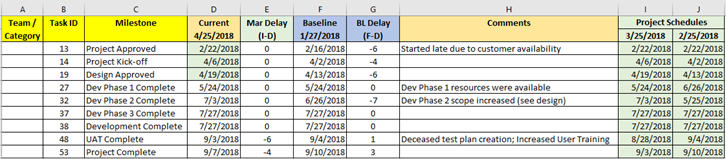
Current milestone finish dates are taken from the project schedule and entered manually into an Excel spreadsheet. Below is the Milestone Table update process:
- Historical milestone dates are stored in columns I and J. When the next read is taken in May, the 4/25/18 column will be copied between columns H and I. Remove “Current” from the new column I and highlighted to show its historical information.
- When entering new current finish dates, change the Current (Date) to the date the Milestone Table was updated. Enter the new Current (Date) in column D and update column E with the previous month.
- For milestones that are completed, highlight the date in column D to show its historical information.
- Update the comments, as necessary.
Timeline and Milestone Table Reporting
For reporting, you may want to show the Timeline and then the Milestone Table for variance details.
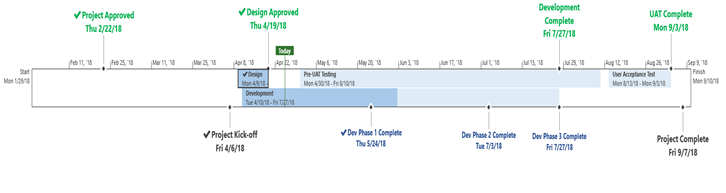
You can report with current milestones only or with baseline milestones; here are examples of both.
1) Current Milestone Reporting:
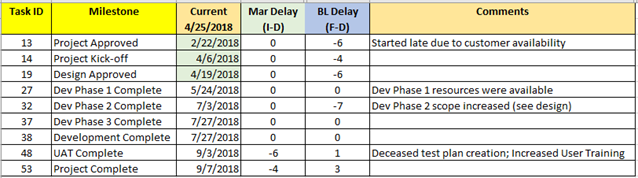
Notice I hid column A, because I wasn’t grouping milestone information. I also hid columns F, I, and J, so that it decluttered the table for reporting purposes.
2) Current and Baseline Milestone Reporting:
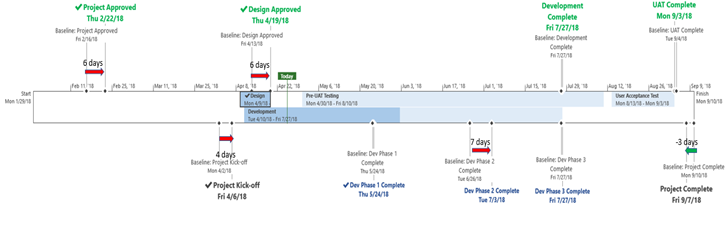
The baseline milestones were entered manually into the schedule, so they could be displayed on the Timeline. The Timeline was then copied to PowerPoint where the arrows and days were added with text boxes. The red arrows show a delay, and the green arrow shows the milestone ahead of schedule. Variances that are small do not need to be displayed. Depending on how much detail your client requires will determine which Timeline you choose to display. Most would like to see the Milestone Table for the details, keeping the Timeline as simple as possible.
Milestone Table Benefits:
Milestone Tables benefit both you and the customer. You gain an effective and easy to use reporting tool for showing progress and schedule issues. You can easily track historical milestone information. Also, the same information can be used for different reports and meetings.
Your customer will like the consistent way to easily see where progress is made, and issues reside. They can see trends in the milestone shifts. They can also use the Milestone Table as a reference for discussing issues and risks.
In Summary
A Milestone Table helps to report shifts in milestones both positive and negative. It keeps the history of the project schedule without having to set numerous baselines. The table acts as a good reference when analyzing the milestone’s historical shifts.
I hope this was helpful. For more about PMO services, please visit www.EPMAinc.com.

For more information on how we can help you and your project management team, send us an email
If you are looking to kick start your project management journey, sign up for our Microsoft Training Classes. We hope you find this blog post helpful. For more tips and tricks on Project Management, follow us on LinkedIn and Instagram
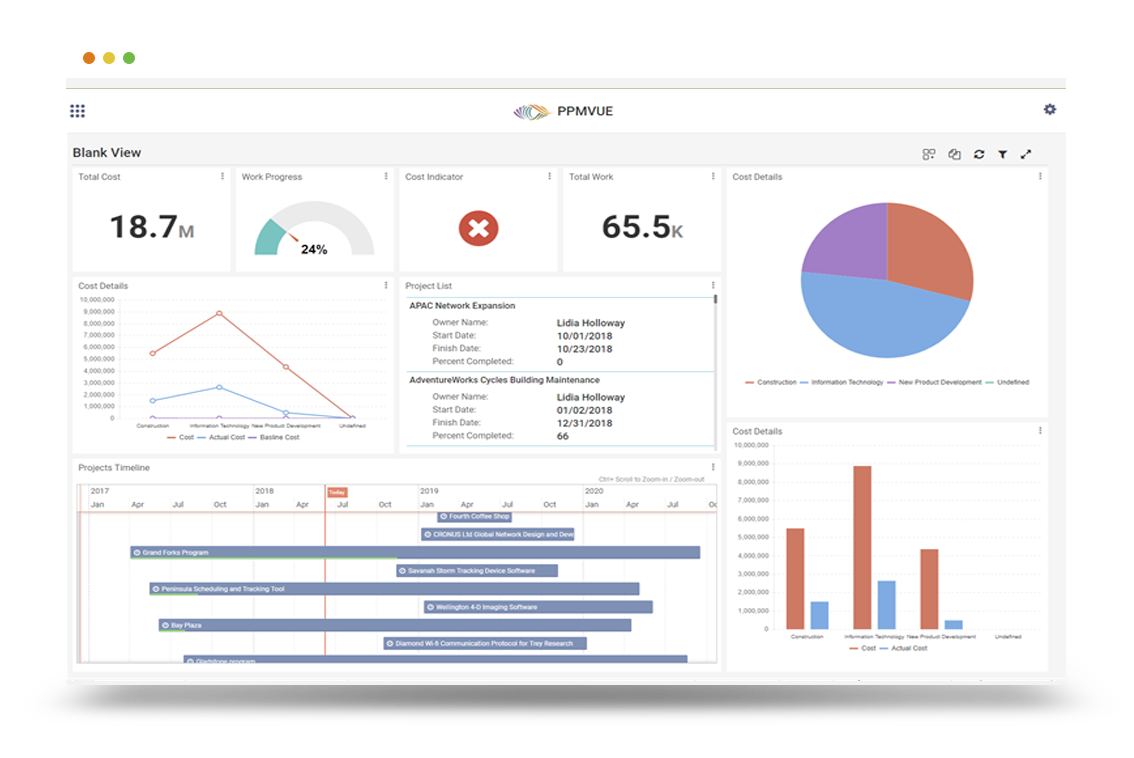
GAIN VISIBILITY WITH PPMVUE
Bring your Project Online data to life with PPMVUE.
Create dashboards and reports for Portfolios, Projects and more in few clicks. Ready to use out of the box and works with any configuration
Download From Office Store Learn More