Capturing Performance Counters
One of the best practices when working with Windows Servers, SharePoint, and Project Server is to track the performance of each server in your SharePoint farm. This will help identifying any bottlenecks and give you a better view of what is happening behind the scene. The problem with performance monitoring that is built-in Windows Server is that it’s not always easy to get the data (performance Counter) from each server without having to rely on a third party application or some other setup to enable real-time reading of the counters in an efficient, user friendly manner. Luckily, In SharePoint 2010/2013 you have the power of the diagnostic logging capabilities built-in SharePoint. This will enable you to gather the desired Performance Counters for each server in the farm and store them in the Logging Database on the SQL Server. This will open up the possibilities for real-time reporting on the farm health once we figure out what data to log and how to extract it.
What do we need to do?
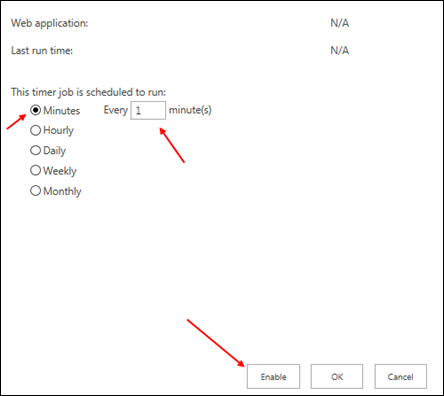
In this blog post, I will walk you through how to configure SharePoint to start recording Pref Counters for each server in your farm. Also, I will show you how to add some of Project Server counters to the configuration. Later on in the Part 2 of this blog, I will walk you through you how to extract the data from the logging database to use in a report. Performance Counters logging is disabled in SharePoint by default. To enable it, we need to go to Central Admin and set the timer job to start recording the counters on a predefined intervals. In this case I will set my sampling interval for 1 minute. Now keep in mind that this will put some overhead on SharePoint and SQL server, so you can try 2-5 minutes interval or whatever suits you needs. In Central Admin >> Monitoring >> Configure usage and health data collection will do that fro both Web and SQL server
Enable health data collection Click on Health Logging Schedule
Select Minutes and add 1, then click enable. repeat for the other counters.
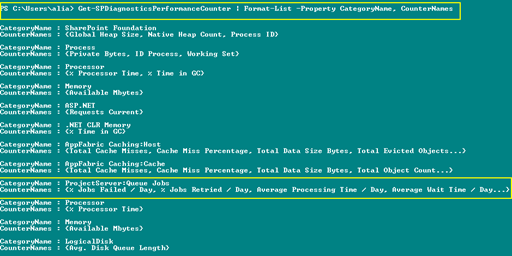
Now let’s go to my favorite place on a SharePoint Server, the SharePoint Management Shell, and run the following command to see what counters are configured and will be recorded. Get-SPDiagnosticsPerformanceCounter 
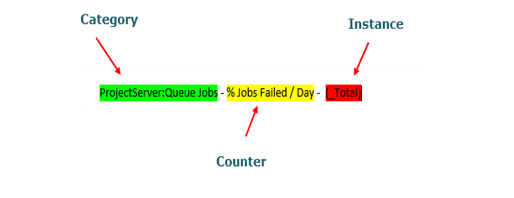
As you can see, there are some counters added by default. This may look different on your enviroment depends on what service application you have setup. Let’s add some counters for Project server. You can also add more if you want to monitor SQL, Windows Server, or SharePoint. But before we start adding the counters, I want to show you what the counters consist of.
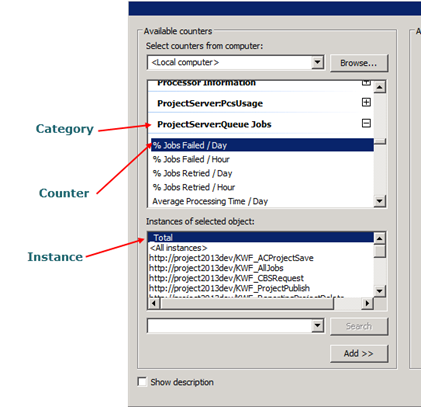
So now we need to get the Category, Counter name, and the instanceof each counter we are going to add. If you wonder where to find this kind of information, open the performance monitor application built-in Windows Server and add new counters then get the names from the wizard. here is what it looks like:
Using SharePoint Management Shell, I will add some of the counters that I like for Project Server (this is the same for 2010 and 2013). Here are the counters I will be adding using the following commands:
Add-SPDiagnosticsPerformanceCounter -category "ProjectServer:Queue Jobs" -Counter "% Jobs Failed / Day" -Instance "_Total"

Add-SPDiagnosticsPerformanceCounter -category "ProjectServer:Queue Jobs" -Counter "% Jobs Retried / Day" -Instance "_Total"

Add-SPDiagnosticsPerformanceCounter -category "ProjectServer:Queue Jobs" -Counter "Average Processing Time / Day" -Instance "_Total"

Add-SPDiagnosticsPerformanceCounter -category "ProjectServer:Queue Jobs" -Counter "Average Wait Time / Day" -Instance "_Total"

Add-SPDiagnosticsPerformanceCounter -category "ProjectServer:Queue Jobs" -Counter "Jobs Failed / Minute" -Instance "_Total"

Add-SPDiagnosticsPerformanceCounter -category "ProjectServer:Queue Jobs" -Counter "Jobs Processed / Hour/Day" -Instance "_Total"
After adding the counters, let’s check and make sure they are added to the configuration.
So, we added the Performance Counters and SharePoint is recording the counters and saving them to the logging database every minute. The counters in this example will be recorded only for server(s) running the project server application. You can also add Processor, Memory, and Hard Disk counters for all the server in the farm. In Part 2 of this blog, I will show you how to run some queries to get the data from the Logging Database in SQL Server. Stay tuned….


