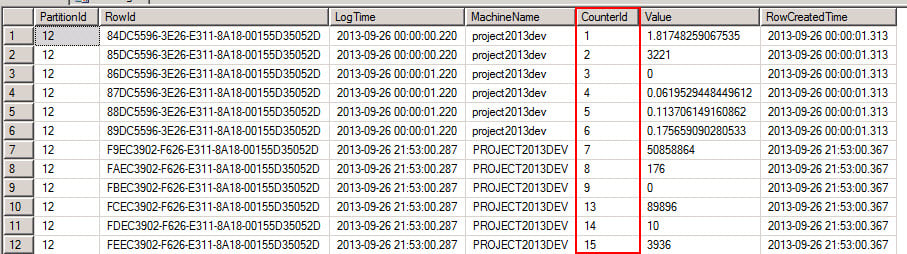
Last Blog, I have showed you how to setup the performance counters for Project Server and SharePoint to start recording into the SharePoint Logging database. Today, I will walk you through how to query the data in the Logging DB to extract the performance counters and their values. The new Performance Counters we created last time are now located in the Logging Database (WSS_Logging). This Database contains many other health and diagnostic data that is captured by different services in SharePoint, but once we added our performance counters, a new set of tables were created to hold the counters data. The data is updated every 1 minute in my case (update interval differs according to your setup). As you can see, this is a great solution for real-time reporting on server performance especially in a large implementation of SharePoint/Project Server. The Performance counters will be stored in few tables called PerformanceCounters_Partition(0-31). The counters are divided into 31 tables (partitions). Now as you can see, this will be hard to query and link all those tables together to get the counters. Luckily, there is a View in the Logging Database called PerformanceCounters that has all the tables linked together but with one minor issue. The view only has the counter ID and does not have the name or the category of the counters as you can see from the screenshot below.
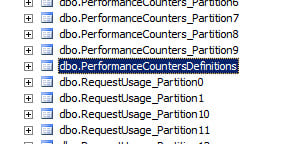
However, if you expand the tables in the database you can see that there is a definition table for the performance counters and it contains the definition of each counter plus the counter ID. So all we need to do is join the table with the view to get a completed performance counters view.
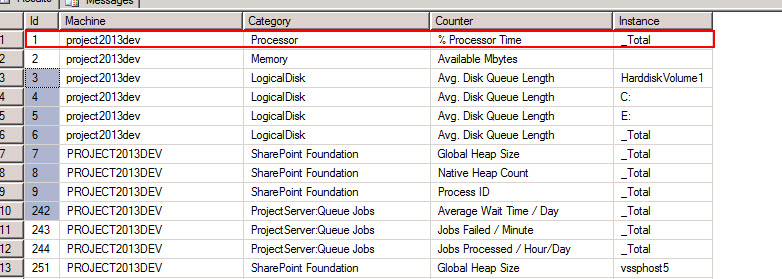
This definition table has all the counters name, category, instance, and it also includes the server names.
Use this query to piece everything together and use the filter (where) to pick your performance counters. in my case, I only selected Project Server Counters, Memory, CPU, and Disk.
SELECT

      cast([LogTime]as DATE) AS [Log Time]
      ,[MachineName]
      ,[CounterId]
      ,d.Category
	  ,d.Counter
	   ,AVG([Value]) AS [Value]
  FROM [WSS_Logging].[dbo].[PerformanceCounters] C left join

  (
  SELECT [Id]

      ,[Category]
      ,[Counter]
      ,[Instance]
  FROM [WSS_Logging].[dbo].[PerformanceCountersDefinitions]
  )D on d.Id = c.CounterId

 where d.[Category] in ('ProjectServer:QueueGeneral', 'ProjectServer:Queue Jobs',
'LogicalDisk', 'Memory', 'Processor' , 'ProjectServer:User Activity',
'ProjectServer:Winproj')-- AND d.Instance = '_Total'
  group by cast([LogTime]as DATE),[MachineName],[CounterId] ,d.Category ,d.Counter

  order by cast([LogTime]as DATE) , [CounterId]
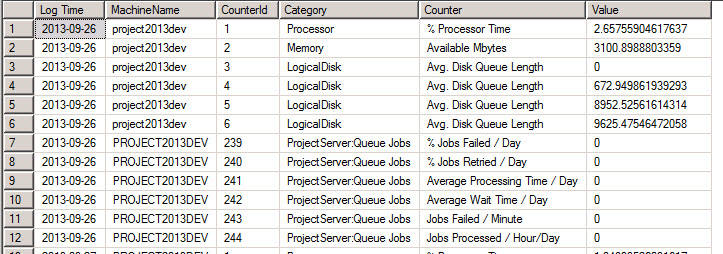
Here is the query output!
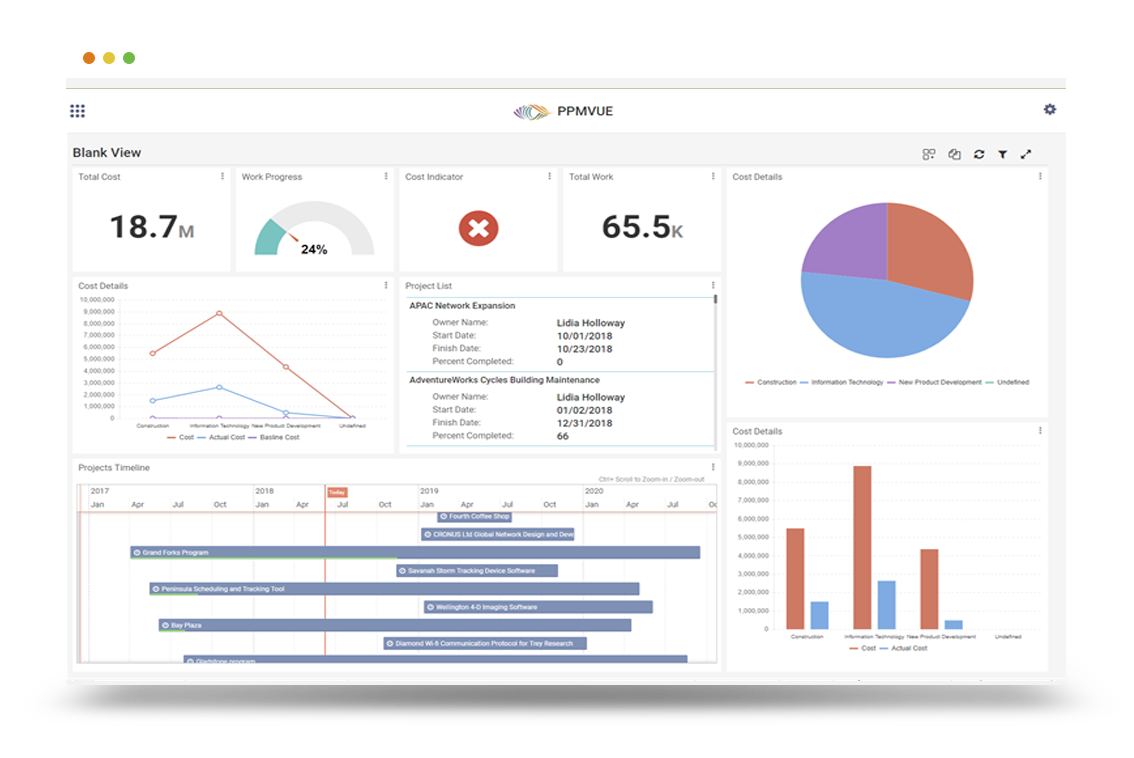
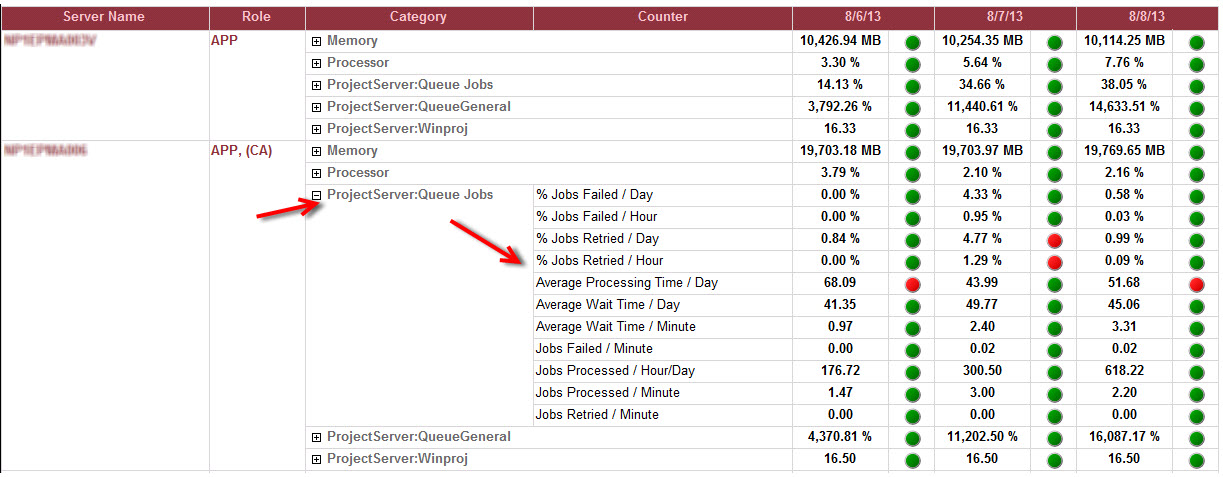
Now that you have a nice time-phased, you can design some reports to get the data in real time! And get instant feedback of your server(s) in the farm. Here is a snapshot of a report that I created using SSRS for a SharePoint/Project Server farm with 8 servers. This was a very vital report to keep up with the server’s performance.
GAIN VISIBILITY WITH PPMVUE
Bring your Project Online data to life with PPMVUE.
Create dashboards and reports for Portfolios, Projects and more in few clicks. Ready to use out of the box and works with any configuration
Download From Office Store Learn More